The 2025 NBA Finals have been one of the best, most competitive and most energizing championship rounds in recent memory — a distinct break from consecutive one-sided Finals that were tidily wrapped up in five games, fueled by a clash of high-octane styles and high-level adjustments showcasing the very best of what the modern NBA has to offer. It’s a series tight and entertaining enough to deserve a seventh game … and, with an emphatic 17-point shellacking in Game 6, that’s precisely what the Indiana Pacers delivered.
Nobody knows what’s going to happen at Paycom Center on Sunday night, when the Pacers and Oklahoma City Thunder lock up one last time, with the Larry O’Brien Championship Trophy awaiting the winner. But while we wait with bated breath for tipoff, we can, and should, zoom out to better appreciate how we got here — at what the hell has transpired over the last two and a half weeks to bring Indiana, OKC and all the rest of us to the precipice of just the 20th Game 7 in the history of the NBA Finals.
Advertisement
Let’s take a look back at what the Thunder and Pacers have already given us, ripping through seven* fun stats that help define the 2025 NBA Finals — a matchup that nobody predicted back in October, and that has provided some of the best basketball anybody’s seen in ages.
* There will be some additional stats and sub-numbers, because I am incorrigible and ungovernable.
We start, appropriately enough, with:
7
That’s how many total points separate these two teams through six games — Thunder 662, Pacers 655. And man, has it felt every bit that close.
It didn’t feel that way at first. The Thunder opened the Finals doing to the Pacers what they’ve done to pretty much everybody else over the course of a magical season that saw them win 68 games with the highest average margin of victory in NBA history: smothering Indiana’s offense into turnover after turnover after turnover. Ever since the Pacers settled in after halftime of Game 1, though, the run of play has been nip-and-tuck, back-and-forth — anybody’s game at any given point.
Advertisement
Indiana authored yet another breathtaking comeback to steal Game 1 (more on that in a moment). Oklahoma City responded with a decisive win in Game 2. The Pacers returned serve in Game 3, protecting home court behind a stellar game from both their stars and their second unit.
The Thunder broke back in Game 4, though, pulling off their own late-game heist thanks to an MVP closing kick from Shai Gilgeous-Alexander and critical contributions from their complementary stars — including Jalen Williams, who slipped the surly bonds of the modifier “complementary” with a 40-point masterclass in Game 5 to get Oklahoma City within one win of the promised land. They wouldn’t get that win in Indianapolis, though, as the Pacers roared off the mat with a ferocious 30-9 second-quarter run to turn Game 6 into a blowout and send the series back to Bricktown knotted at 3-3.
The tally, then: One commanding home win apiece; one pretty comfortable home win apiece; one skin-of-their-teeth road win apiece. Six games, and a grand difference of seven points.
Advertisement
And if it’d been five, the Thunder might already be champions.
97.7%
That’s how high the Thunder’s win probability reached at its peak in Game 1, according to Mike Beuoy’s charting at Inpredictable — the moment Gilgeous-Alexander hit his second free throw to give them a nine-point lead, 108-99, with 2:52 to go in the fourth quarter.
And then … well, you know.
That Indiana finish — a 12-2 run over the final 2:52, with Pascal Siakam, Andrew Nembhard and Aaron Nesmith all hitting huge shots to set up Haliburton’s game-winner — completely changed the terms of engagement in this series. If just one of those jumpers rattles out, OKC’s up 1-0, and maybe the Pacers come away feeling like they’d squandered their best chance to stagger the favorite. Instead, they all found the bottom of the net, making the Thunder just the latest in a long line of opponents to be stunned by the Pacers’ late-game shot-making and execution … and making it conceivable that Indiana could pull the massive upset in this series.
Advertisement
And now, here we are.
28.5%
That’s the Thunder’s 3-point attempt rate in this series — meaning that 28.5% of their total field goal attempts in the NBA Finals have come from behind the arc.
That’s a drop of more than 8% from the share of their shots that came from deep through the first three rounds of the 2025 NBA playoffs. It’s a decline of nearly 10% from the Thunder’s regular-season long-ball rate. And it’s significantly below the lowest mark of any team during the 2024-25 regular season — 32.1%, belonging to Nikola Jokić’s Denver Nuggets. (No team has finished the regular season below 30% since 2020-21.)
Advertisement
Which is to say: The Thunder just have not been able to get up 3-point attempts in this series at anything like the clip to which they’ve become accustomed, and in fact have been limited from beyond the arc to an eye-popping degree that’s out of step with the rhythm and offensive flow of the modern NBA.
“Yeah, it’s definitely been an issue in some of these games,” Thunder head coach Mark Daigneault said after Game 6. “Game 4 comes to mind — I think we got 17 in that game. I thought we found some things in Game 5. I thought they did a really good job on us [in Game 6, when OKC went just 3-for-20 from 3 through three quarters]. I thought the low volume and the accuracy was reflective of the way they guarded us, and our inability to create a rhythm against that the way we’ve been able to do in some of the other games.”
Indiana finished fifth in the NBA during the regular season in limiting opponents’ 3-point attempts and has been even better at running teams off the line in the postseason. Its defense — a clear weakness during the 2023-24 season and a work in progress early in the 2024-25 campaign, but a top-10 unit since early December — has been at its best in this series, with timely help, sharp rotations and hellacious closeouts to make Oklahoma City’s would-be shooters think better about letting it fly, preferring to put the ball on the deck and try to make hay in the lane.
Advertisement
(A quick sub-number here: 117.5. That’s how many more passes per game the Pacers are throwing per game than the Thunder, according to Second Spectrum tracking — 336 to 218.5. Through the first three rounds, Oklahoma City was averaging 256.6 passes per game; during the regular season, it was 270.7. The way Indiana is defending has forced OKC into more one-on-one attacks, more zero-or-one-pass possessions, and fewer of the sorts of drive-and-kick, swing-swing, ball-finds-wide-open-shooter-in-rhythm trips with which SGA and Co. have punished the league for two years running.)
That plan of attack can work. Gilgeous-Alexander is the MVP of the league, Williams is an ascendant All-NBA talent, and the Thunder have no shortage of elite athletes who can finish in the paint. Over a large enough sample, though, trading 3s for 2s becomes a problem; all told, Indiana has taken 48 more 3s than Oklahoma City in this series, and made 18 more — one big reason why the Pacers have been able to not just stick with the heavily favored Thunder, but put themselves in position to wrest the championship from their hands.
Speaking of those closeouts …
38.33
That’s how many miles the Thunder and Pacers are covering per game, on average, in these Finals — 19.42 for Indiana, and 18.91 for OKC.
Advertisement
As my colleague Tom Haberstroh noted during this week’s episode of The Big Number, that is the longest distance covered for any Finals matchup since the player-tracking era began in 2013-14 — a full 4.5 miles per game more than Boston and Dallas in last year’s Finals:
And they’re not just puttering around all over the court: The Pacers are moving at an average speed of 4.51 miles per hour, while the Thunder are going 4.39 miles per hour, according to Second Spectrum — both higher than any other Finals team since 2013-14, and significantly higher than any team besides the 2014 “Beautiful Game” Spurs.
Those speed and distance numbers encapsulate the sheer physical demands of this series: the tendency of both defenses to pick up ball-handlers in the backcourt, turning the full 94-by-50 expanse of the court into a battleground, and the ferocity of the closeouts that turn good looks into contested ones.
Advertisement
(Another sub-number here: Through the end of the conference finals, the Thunder were taking 56.1 shots per game with at least 4 feet of space from the nearest defender, and the Pacers were getting 52.8 per game. In the Finals, that’s down to 50.4 “open” or “wide-open” shots per game for Indiana, and just 46.7 — nearly 10 fewer per game — for Oklahoma City.)
You can feel the revving-into-the-red level of exertion on damn near every possession — a big part of what has made this series, in which the average age of the participants (weighted for minutes played) is just 26 years old, according to analysis by Owen Phillips of The F5, by far the lowest of this century, so energetic and dynamic. We’re watching the crowning of the first Gen Z champion in NBA history, and the impact of all those young legs — the ground they can cover in the half court, the way they stretch the floor in transition, the way they get back on defense to prevent easy transition buckets, etc. — really pops off the screen, producing an incredibly compelling brand of basketball for the full 48 minutes …
… which makes the contributions of Indiana’s relative graybeard all the more impressive.
10
That’s how many NBA players have scored 100 points, grabbed 50 rebounds, dished 20 assists, snagged 10 steals and blocked 5 shots over the course of a Finals series, since the NBA started tracking steals and blocks back in 1973.
Advertisement
That list includes six players with Most Valuable Player trophies: Magic Johnson, Larry Bird, Kareem Abdul-Jabbar, Hakeem Olajuwon, Kobe Bryant and LeBron James. It includes Scottie Pippen and Kawhi Leonard, two of the most decorated championship-winning two-way wing players over the last 40 years. It includes Jimmy Butler, one of the greatest postseason risers in NBA history.
And now, it includes Pascal Siakam.
The 31-year-old forward is averaging a team-leading 19.8 points and 8.3 rebounds per game in the Finals, while also adding 4.0 assists, 1.7 steals and 1.3 blocks in 32.8 minutes a night. For much of this series, Indiana’s best source of half-court offense has been Siakam strong-arming his way into a cross-match against shorter or slighter OKC players — Gilgeous-Alexander, Cason Wallace, Aaron Wiggins, even All-Defensive Team menace Luguentz Dort — and going at them in the paint, or facing up on Chet Holmgren/Isaiah Hartenstein on the perimeter and taking them off the dribble. Siakam also frequently serves as Haliburton’s favorite Hail Mary receiver in transition, forever leaking out and relentlessly sprinting the length of the floor in search of early offense and easy baskets against the Thunder’s elite defense.
Advertisement
Siakam has been integral on the defensive end, too. He spent most of the first five games cross-matched against the likes of Dort, Alex Caruso and Holmgren so that he could sag off them on the perimeter and serve as an incredibly disruptive help defender on the interior, loading up in the gaps to keep Gilgeous-Alexander and Williams away from the rim, swiping down for steals and deflections, providing secondary rim protection. After Williams’ Game 5 explosion, though, Siakam slid over to pick up a larger share of the primary responsibility on J-Dub in Game 6, limiting him to just two points over 12 possessions when they were matched up against one another.
I thought I had a pretty good bead on how good Siakam is; I was writing about him as the Raptors’ unsung hero in November of 2018, and as a potential future superstar in February of 2019. But after spending most of the last two rounds traveling with the Pacers, getting an up-close-and-personal look at how well-rounded and overwhelming a difference-maker he can be, first against the Knicks en route to Eastern Conference MVP honors and now against the Thunder, I’ve got to be honest: I’ve just been blown away by how freaking good this guy has become.
The trade to bring him to Indianapolis will go down as an absolute heist, no matter what the draft picks the Pacers sent to Toronto turn into, even if the Pacers lose Game 7. And if they win Game 7 … well, what do you call a two-time NBA champion (and possible Finals MVP?), three-time All-Star and two-time All-NBA selection who’s just a couple of healthy seasons away from 15,000 career points, 5,000 rebounds, 3,000 assists, 700 steals and 450 blocks — numbers that only 31 other players have ever reached in the NBA? The answer very well might be what you call the other nine guys on that list at the top of this section: Hall of Famer.
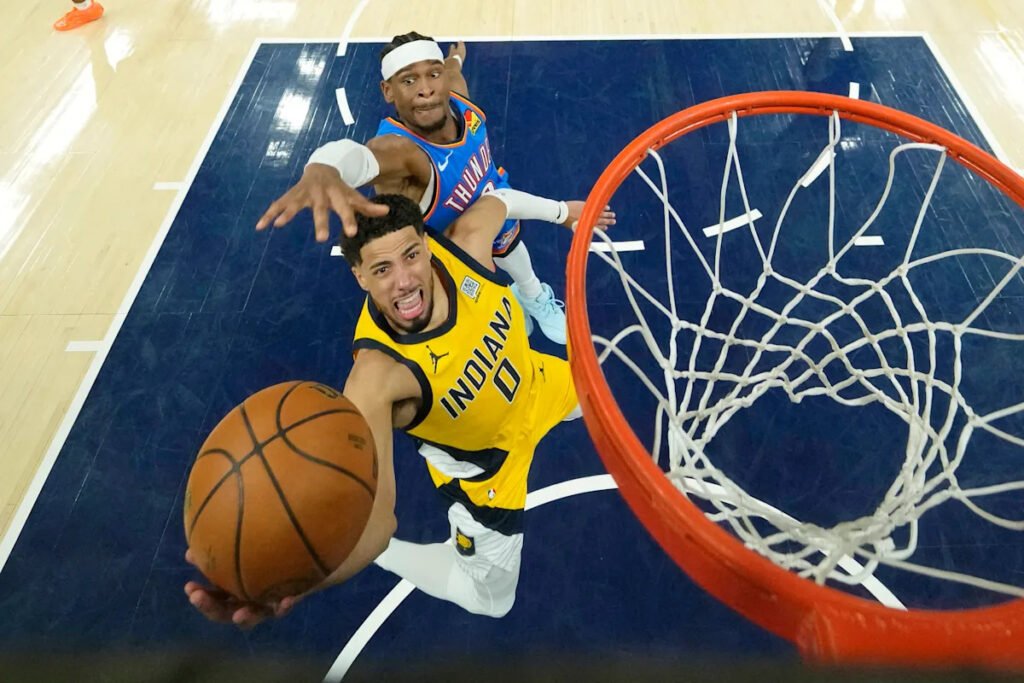
17.9
That’s the on-court/off-court differential of Tyrese Haliburton in the Finals — the highest of any Pacers player getting rotation minutes in the series. (Sorry, Tony Bradley.)
Advertisement
What that means: In 203 minutes with Haliburton on the court, Indiana has outscored Oklahoma City by 3.9 points per 100 possessions. In 85 minutes without their star/All-Star/superstar/whatever-the-hell-you-want-to-call-him point guard, the Pacers have been outscored by a whopping 14 points-per-100. That’s effectively the gap between Indiana performing like a top-10, 50-win club … and like a Division III also-ran facing NBA competition.
That stands to reason — not because alternative ball-handling options T.J. McConnell and Andrew Nembhard are terrible, but rather because Haliburton has, ever since coming over in a franchise-shaking trade from the Kings, been the engine of Indiana’s fast-paced, high-octane, pass-heavy, turnover-light attack.
The Pacers turn the ball over more frequently and generate 3-pointers way less frequently when Haliburton’s not at the controls. They don’t get out in transition as often, and they don’t score as efficiently when they do — particularly off of defensive rebounds, where Haliburton’s penchant for throwing hit-ahead passes helps send Indiana flying into early offense against scrambled defenses.
Advertisement
That’s why things seemed so dire for the Pacers when Haliburton went down early in Game 5, hobbled through the rest of it and was diagnosed with a right calf strain afterward. Against Oklahoma City in the Finals, the Pacers have scored just 96.2 points-per-100 with Haliburton on the bench — nearly 10 points-per-100 below Washington’s league-worst regular-season offensive rating. Without him, how could they score enough?
As luck would have it, they didn’t have to find out. Haliburton didn’t just play in Game 6; he played great, scoring 14 points with five assists and three 3-pointers in 23 minutes, during which the Pacers outscored the Thunder by 25 points.
Even with something less than his customary burst off the bounce, Haliburton’s presence makes an impact: as a willing and accurate 3-point shooter, off the dribble or off the catch; as a geometry-warping playmaker capable of (and eager to) throw the kind of passes that can distort Oklahoma City’s base defense; as a more-helpful-than-you’d-think defensive playmaker who has tallied 8 steals, 4 blocks, 16 deflections and 7 loose balls recovered in these Finals; and, crucially, as the steadiest pair of hands in Rick Carlisle’s rotation — the player best equipped to take care of the basketball and prevent the Thunder from creating the kind of live-ball turnovers that gift them runout opportunities and rhythm-creating fast-break baskets.
Advertisement
Which brings us to our seventh* fun stat of this series:
+2
That’s Oklahoma City’s lead in perhaps the most critical category in these NBA Finals: live-ball turnovers.
The Pacers have committed 61 live-ball turnovers through six games, according to PBP Stats, compared to 59 for the Thunder. That brand of miscue is particularly damaging for a defense, because it allows the turnover-creator to either get uncontested runout layups and dunks, or to attack against a scrambling, backpedaling opponent, rather than against a set, locked-in defense.
The difference tends to be massive. For the series, the Thunder have a 96.6 offensive rating in the half court, compared to a 110.8 offensive rating in transition. That gap of 14.2 points-per-100 is a yawning chasm — the difference between one of the NBA’s best offenses and one of its very worst. And for Indiana, it’s been even bigger: 92.6 points-per-100 in the half court, and 121.1 points-per-100 in transition.
Advertisement
Both teams desperately want to keep the other out of transition, and from piling up points on those plays. For the series, Oklahoma City is +16 in points scored off turnovers … which, in a series that, again, has been separated by just seven points across six games, is an awfully big deal. And it could very well wind up being the determining factor in Game 7: As Phillips noted at The F5, “Outside of Game 1, the team that has won the liveball turnover battle has won each game of the Finals.”
If you want to get a sense of who’s going to wind up hoisting the Larry O’B late on Sunday, keep an eye out for live-ball turnovers: who’s forcing them, who’s coughing them up, and who’s doing the better job of cashing in on them. Chances are, that’ll tell you who’s going to end this remarkable, thrilling series on top — and who’s going to wind up coming up crushingly, tantalizingly short.